This isn't meant to be a tutorial on C programming, but an introduction to debugging and disassembling C programs. If this is your first time seeing C code, that's ok too. I am running Windows XP inside a virtual machine, and this is important because modern operating systems include mitigations and safety mechanisms, such as randomizing memory addresses, that will make this hard to follow and give unexpected results. We will explore those mitigations and safety mechanisms as we advance our knowledge, but for now, we're starting at the beginning and understanding why those mitigations were needed.
Everyone starts learning a new programming language by getting it to compile and get it to output something to the screen.
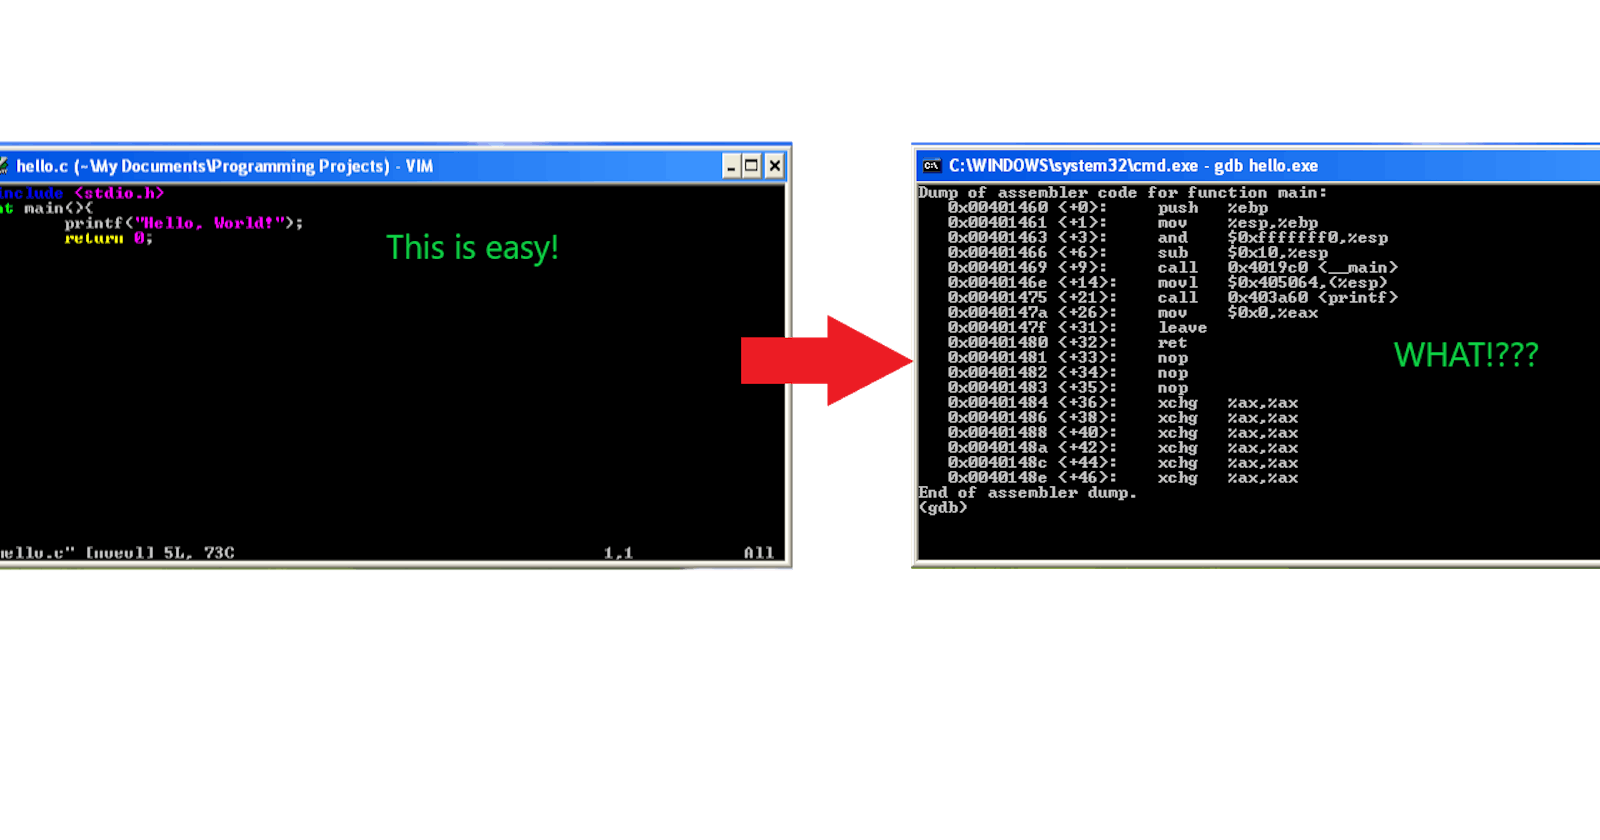
So we write our first program, and save it as hello.c

Then we must compile it:
gcc hello.c
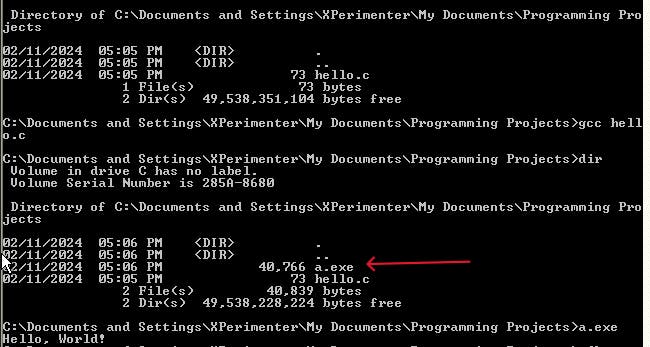
By default this will name the compiled program as a.exe:

In order to specify our own file name upon compilation, we use the -o flag followed by the name you want the executable to be:
gcc -o hello hello.c
This will compile hello.c into hello.exe:

To run the program:
hello.exe

It printed "Hello, World!" to the screen as expected. C is considered a low level language, as you have direct access to memory. I like to think of C as the lowest high level language because C still has to be compiled into a language the processor understands, and that is the assembly language.
GDB is a debugger that comes with the Mingw32 compiler. GDB will allow us to see the assembly language that an executable was compiled into.
To run the GDB debugger:
gdb a.exe

Now we need to set a break point, and we want it to stop at the main function:
break main
Then we can see the assembly instructions by disassembling main:
disassemble main

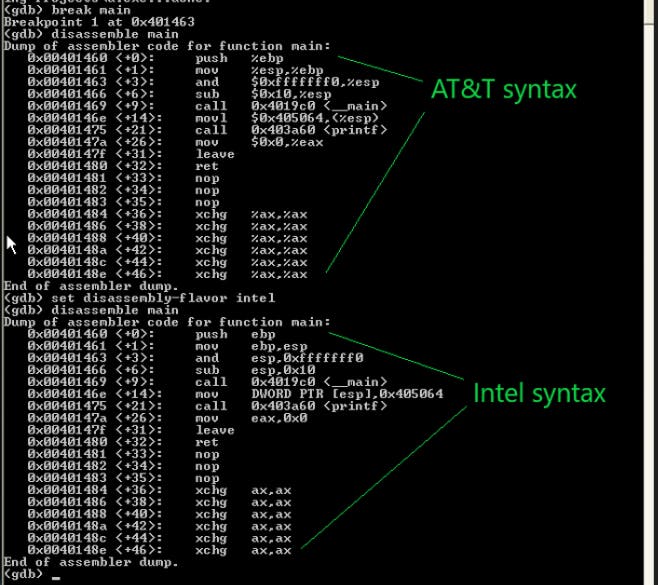
By default, GDB uses AT&T syntax. You'll notice the % signs in front of the register names, and the biggest difference is, if you look at the very first mov instruction, the registers swapped positions between the AT&T and the Intel syntax.
In AT&T syntax you'd read move whatever is in the source register into the destination register. (mov source, destination).
In Intel syntax, you read it the same, but the source register is actually the second operand. (mov destination, source).
That's the last time I'll ever look at AT&T syntax, but it is an important distinction to note.
Notice I told GDB to use intel syntax with the following command:
set disassembly-flavor intel
What does any of this mean?
Now we need to know what registers are, what op codes are, and how programs use memory on the stack and the heap.

